
Earlier installments of this series (Part 1, Part 2 and Part 3) have examined how to use IDAPython to make life easier. Now let’s look at how reverse engineers can use the colors and the powerful scripting features of IDAPython.
Analysts are often faced with increasingly complex code, and usually it’s not readily apparent what code is run during dynamic execution. Using the power of IDAPython, we will not only be able to identify what instructions within a program are running, but also how many times those instructions were used.
Background
For this particular blog post, I wrote a simple program in C. The following code was written and compiled for this exercise:
|
1 2 3 4 5 6 7 8 9 10 11 12 13 14 15 16 17 18 19 20 21 22 23 24 25 26 27 28 29 |
#include "stdafx.h" #include <stdlib.h> #include <time.h> int _tmain(int argc, _TCHAR* argv[]) { char* start = "Running the program."; printf("[+] %s\n", start); char* loop_string = "Looping..."; srand (time(NULL)); int bool_value = rand() % 10 + 1; printf("[+] %d selected.\n", bool_value); if(bool_value > 5) { char* over_five = "Number over 5 selected. Looping 2 times."; printf("[+] %s\n", over_five); for(int x = 0; x < 2; x++) printf("[+] %s\n", loop_string); } else { char* under_five = "Number under 5 selected. Looping 5 times."; printf("[+] %s\n", under_five); for(int x = 0; x < 5; x++) printf("[+] %s\n", loop_string); } return 0; } |
Once we load up this binary in IDA Pro, we can see the expected loops and code redirection statements. If we were to look at this example without knowing the underlying code, we could likely determine what was happening through static analysis.
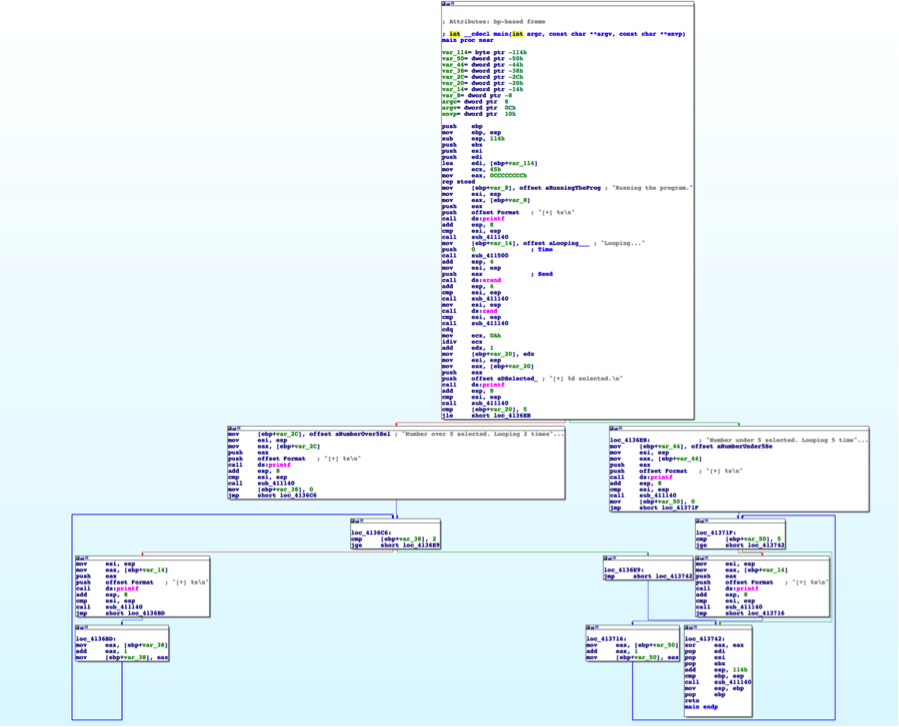
Figure 1 Graph disassembly of program
However, what if we wanted to determine what blocks of code were executed at runtime? Let’s approach this challenge using IDAPython.
Scripting in IDAPython
One of the first challenges we must tackle includes stepping through every instruction, which we’ll accomplish using the following code. (Debugging print statements have been included to demonstrate what instructions are being executed.)
|
1 2 3 4 5 6 7 8 9 10 11 |
RunTo(BeginEA()) event = GetDebuggerEvent(WFNE_SUSP, -1) EnableTracing(TRACE_STEP, 1) event = GetDebuggerEvent(WFNE_ANY|WFNE_CONT, -1) while True: event = GetDebuggerEvent(WFNE_ANY, -1) addr = GetEventEa() print "Debug: current address", hex(addr), "| debug event", hex(event) if event <= 1: break |
In the above code, we first start the debugger and execute to the entry point, using a call to ‘RunTo(BeginEA())’. The following call to GetDebuggerEvent() will wait until this breakpoint is reached.
Then we proceed to enable tracing in IDA Pro using a call to EnableTracing(). The subsequent call to GetDebuggerEvent() will continue the debugger, now configured for step tracing. Finally, we enter a loop and iterate through each address until we reach an event condition that signifies that the process has terminated. The tailing output of this particular script looks like the following in IDA Pro:
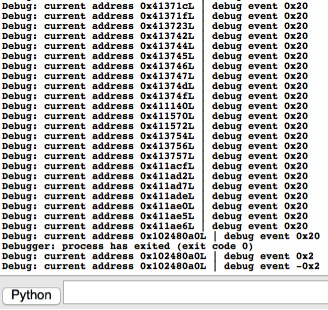
Figure 2 Output of IDAPython script
The next step is to retrieve and assign a color to each affected line that is executed. To do this, we can use the GetColor() and SetColor() functions respectively. The following code will get the current color of a given line, determine what color to set, and set this color for the line.
For this example, I used a color palette of four different shades of blue. The darker shades indicate that a particular line was executed repeatedly. (Readers are encouraged to modify this to meet their personal preferences.)
|
1 2 3 4 5 6 7 8 9 10 11 12 13 14 15 16 |
def get_new_color(current_color): colors = [0xffe699, 0xffcc33, 0xe6ac00, 0xb38600] if current_color == 0xFFFFFF: return colors[0] if current_color in colors: pos = colors.index(current_color) if pos == len(colors)-1: return colors[pos] else: return colors[pos+1] return 0xFFFFFF current_color = GetColor(addr, CIC_ITEM) new_color = get_new_color(current_color) SetColor(addr, CIC_ITEM, new_color) |
Running the above code on a given line that has no color will result in it being set to the lightest shade of blue. Additionally, running this code on that same line again will turn it a darker shade of blue.
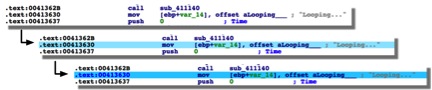
Figure 3 Demonstration of color changes based on number of instruction calls
We can use the following code to remove any previous coloring on the IDA Pro file. Setting the color to 0xFFFFFF will set it to white, or effectively remove any other color that was previously present.
|
1 2 3 |
heads = Heads(SegStart(ScreenEA()), SegEnd(ScreenEA())) for i in heads: SetColor(i, CIC_ITEM, 0xFFFFFF) |
Putting all of this code together, we have the following result:
|
1 2 3 4 5 6 7 8 9 10 11 12 13 14 15 16 17 18 19 20 21 22 23 24 25 26 27 28 |
heads = Heads(SegStart(ScreenEA()), SegEnd(ScreenEA())) for i in heads: SetColor(i, CIC_ITEM, 0xFFFFFF) def get_new_color(current_color): colors = [0xffe699, 0xffcc33, 0xe6ac00, 0xb38600] if current_color == 0xFFFFFF: return colors[0] if current_color in colors: pos = colors.index(current_color) if pos == len(colors)-1: return colors[pos] else: return colors[pos+1] return 0xFFFFFF RunTo(BeginEA()) event = GetDebuggerEvent(WFNE_SUSP, -1) EnableTracing(TRACE_STEP, 1) event = GetDebuggerEvent(WFNE_ANY|WFNE_CONT, -1) while True: event = GetDebuggerEvent(WFNE_ANY, -1) addr = GetEventEa() current_color = GetColor(addr, CIC_ITEM) new_color = get_new_color(current_color) SetColor(addr, CIC_ITEM, new_color) if event <= 1: break |
When we ran this code on our program, we saw the following, which highlights the executed assembly instructions. As seen in the below image, the instructions that were executed multiple times have a darker shade of grey, allowing us to easily understand the execution flow.
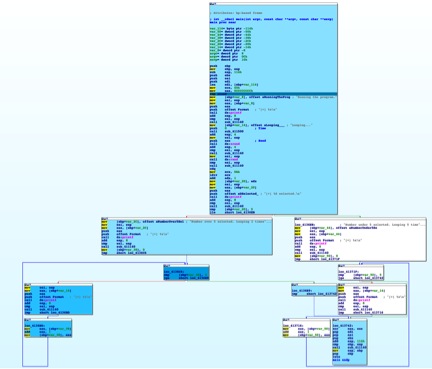
Figure 4 Result of running IDAPython script
Conclusion
The example demonstrated in this blog is admittedly a simple one, showing the use of IDA Pro’s debugging capabilities in tandem with the granular coloring options provided in the API. This technique could save an analyst a wealth of time tracing through a complex application’s code.
For more on using IDAPython to make your life easier, read Part 1, Part 2 and Part 3 of this series.
Get updates from
Palo Alto
Networks!
Sign up to receive the latest news, cyber threat intelligence and research from us
By submitting this form, you agree to our Terms of Use and acknowledge our Privacy Statement.