
In the first two posts of this series (Part 1 and Part 2), we discussed using IDAPython to make your life as a reverse engineer easier. Now let’s look at conditional breakpoints.
While debugging in IDA Pro, there are often situations where an analyst wishes to break on a specific address, but only when a certain condition occurs. An example of this might include breaking on a call to a particular function, but only when a specific argument is passed to it. Another instance I personally run into is breaking when a specific library is loaded into my analysis virtual machine. Today, I’m going to look at this specific problem and discuss ways to handle it with IDAPython.
Background
An analyst is often tasked with reversing a DLL. In certain instances, the file in question may be loaded by some other executable. One solution to tackling this problem would be to ensure that the debugger breaks on each instance of a library loading, and then stops when the DLL or driver finally loads.
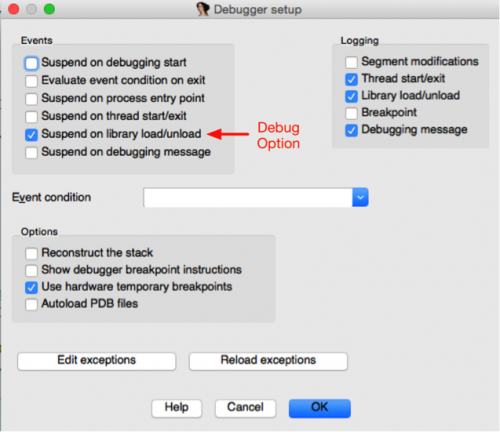
Figure 1 Debug option to break on each library load
However, this process often proves cumbersome, as it usually requires an analyst to stop and start: resuming execution, determining what the most recent library or driver was loaded and seeing if it’s the correct one. It would be much easier for an analyst to simply run a single command, sit back, and wait for the interested file to be loaded.
Conditional Breakpoints
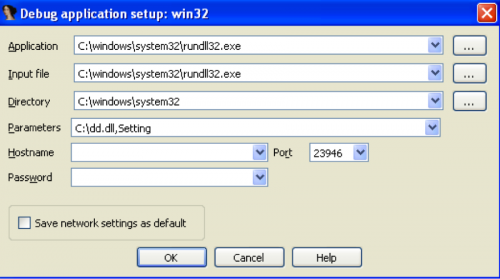
For this particular example, we’re working with a file named ‘dd.dll’. This particular file is normally injected into another process by an exploit after being extracted during runtime. To run this dynamically into IDA Pro, I’m going to load the rundll32.exe executable located in the system32 directory, and supply the dd.dll file as an argument, as seen below. The rundll32.exe executable allows a user to load a specified DLL at a given export name. For this particular sample, I’m interested in the DLL’s ‘Setting’ exported function. Then I supply the following arguments to IDA Pro:
The next step in the process is to identify the correct place to set a breakpoint after a DLL is loaded by the executable. To do so, I initially check the ‘Suspend on library load/unload’ in the debugger setup. After suspending on the first instance of a DLL being loaded, I can see that a breakpoint is set just after a call to NtMapViewOfSection.
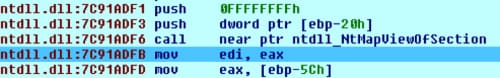
Next I use the address of 0x7C91ADFB as a breakpoint. In my code, I use calls to add_bpt() and enable_bpt() to create and enable this breakpoint.
|
1 2 3 4 5 6 7 8 9 10 |
''' ntdll.dll:7C91ADF1 push 0FFFFFFFFh ntdll.dll:7C91ADF3 push dword ptr [ebp-20h] ntdll.dll:7C91ADF6 call near ptr ntdll_NtMapViewOfSection ntdll.dll:7C91ADFB mov edi, eax ''' address = 0x7C91ADFB # Just after NtMapViewOfSection add_bpt(address, 0, BPT_SOFT) enable_bpt(address, True) |
At this stage, I’ve setup a breakpoint at 0x7C91ADFB and the debugger will break every time a DLL is loaded. In order to ensure a breakpoint only occurs when ‘dd.dll’ is loaded, we must make use of a conditional breakpoint. A conditional breakpoint allows the analyst to use code, either IDC or Python in the latest version, to determine if a breakpoint actually is triggered or not. If the return value of the code is True, the breakpoint will trigger. Otherwise, it will be ignored. To use Python, we first set Python as the default programming language. Then, we store our Python code to a variable and use this variable in a call to SetBptCnd(), which sets this code as a condition to our breakpoint. After the condition is set, we continue the debugger and wait until a suspend debugger event is witnessed. This ends up looking like the following:
|
1 2 3 4 5 6 7 8 9 10 11 12 13 14 15 16 17 18 19 20 |
address = 0x7C91ADFB # Just after NtMapViewOfSection RunPlugin("python", 3) # Python default programming StartDebugger("","",""); dll = "dd.dll" condition = """ for m in Modules(): if "%s".lower() in m.name.lower(): print "Breaking on", m.name.lower() del_bpt(%d) return True return False """ % (dll, address) add_bpt(address, 0, BPT_SOFT) enable_bpt(address, True) SetBptCnd(address, condition) continue_process() GetDebuggerEvent(WFNE_SUSP, -1) |
The actual code that is used for the conditional breakpoint is:
|
1 2 3 4 5 6 |
for m in Modules(): if "dd.dll".lower() in m.name.lower(): print "Breaking on", m.name.lower() del_bpt(0x7C91ADFB) return True return False |
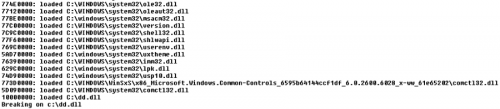
The code will iterate over all of the loaded modules by the executable, and searches to determine if ‘dd.dll’ has been loaded. If it has, a debugging message is printed, the initial breakpoint is removed, and a boolean value of True is returned, signifying that the breakpoint should be triggered. When executed, we see the following in our IDA Pro output window:
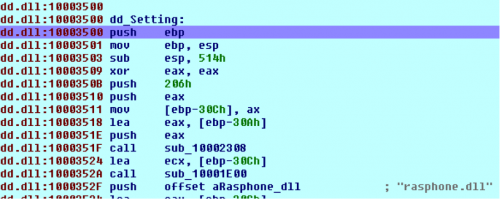
At this stage, we can set our breakpoint at the desired exported function of ‘Setting’ and run the program until the breakpoint fires. In order to automatically perform this step, the following code can be used:
|
1 2 3 4 5 6 7 8 9 10 11 12 13 14 15 16 17 18 19 |
def get_names(base, size, desired_name): current_address = base while current_address <= base+size: current_address = NextHead(current_address) print hex(current_address) if desired_name in Name(current_address): return current_address for m in Modules(): if 'dd.dll' in m.name.lower(): base = m.base size = m.size analyze_area(base, base+size) setting = get_names(base, size, "Setting") if setting: add_bpt(setting, 0, BPT_SOFT) enable_bpt(setting, True) continue_process() GetDebuggerEvent(WFNE_SUSP, -1) |
This code will iterate over the loaded modules, looking for ‘dd.dll’. Once identified, we analyze the code that encompasses this DLL. We then iterate through this code looking for names, searching for the name of ‘Setting’. Once identified, we set a breakpoint on this address, continue the debugger, and wait for the breakpoint to be triggered. When executed, we see our breakpoint has fired as expected on the desired address.
Conclusion
While this technique of setting a conditional breakpoint might seem trivial, it can save an analyst an enormous amount of time overall. A small snippet of code can replace a manual process of continually breaking on a single location over and over until the desired criteria is met. Once again, we’ve seen the power of using IDAPython while reverse engineering a sample, which has saved us valuable time and energy.
Get updates from
Palo Alto
Networks!
Sign up to receive the latest news, cyber threat intelligence and research from us
By submitting this form, you agree to our Terms of Use and acknowledge our Privacy Statement.