Applications and Threats - Analyzed Together for the First Time.
Feb 21, 2013
2 minutes
16 views
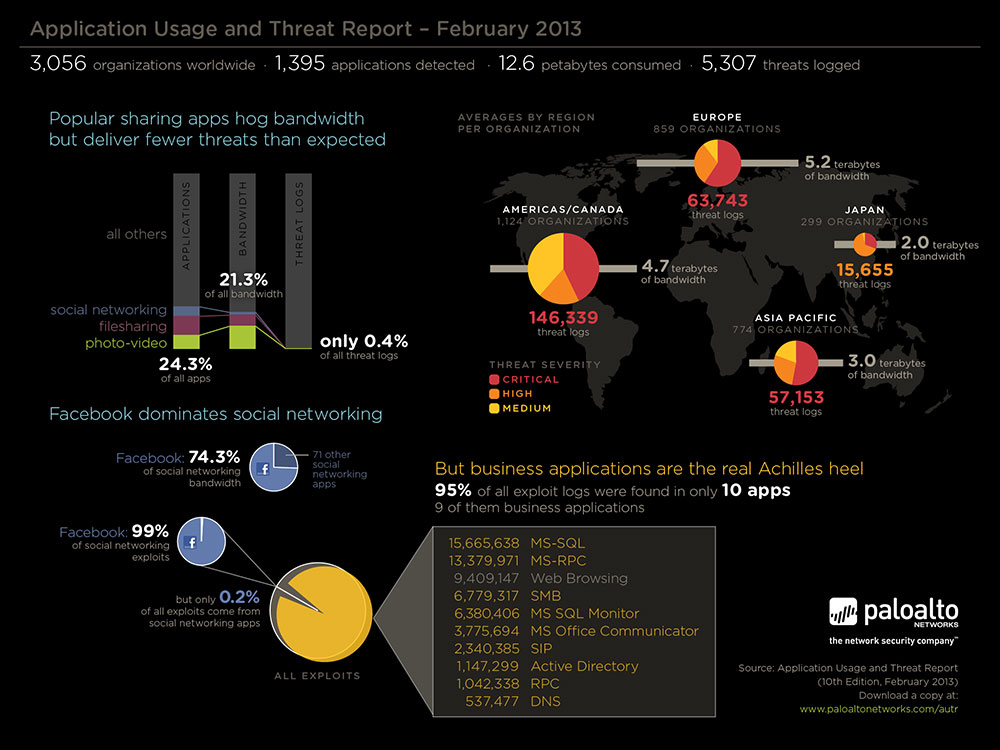
This edition of the Application Usage and Threat Report marks an evolution and an associated name change. For the first time, the report maps application usage and threat activity as seen on enterprise networks between May and December 2012. This report summarizes network traffic assessments performed on more than 3,000 networks, encompassing 1,395 applications, 12.6 petabytes of bandwidth, 5,307 unique threats and 264 million threat logs.
The findings around the volume of threat logs seen in common sharing applications was not what was expected while the threat activity observed, specifically exploits, in datacenter and infrastructure applications validated that high value assets are a target. The analysis of malware logs highlighted how adept cybercriminals are at hiding their actions within traffic that may not normally be blocked, specifically SSL, UDP and DNS.

Specific findings include:
- High profile sharing applications represent lower than expected threat volume. Social networking, video, and file sharing applications represent 25% of the applications, 20% of the bandwidth but only 0.4% of the threat logs, primarily exploits. This is not to say these applications are low risk – but the volume is low when compared to the volume and frequency of use, and the threats found in the other applications.
- Exploits target high value, business applications and assets.The data indicates that exploits are bypassing the “crunchy” perimeter security and targeting enterprises’ most valued assets – their “tender” business applications. The data confirms the “crunchy on the outside, tender on the inside” position;out of 1,395 applications found, 10 were responsible for 97% of all exploit logs observed and 9 of them are business critical applications.
- Custom/unknown applications and malware – low volume but high risk. While small in volume, unknown/custom traffic is high in risk, exemplifying the 80%-20%. The highest volume of malware logs (55%) were found in custom or unknown udp – yet it represented only 2% of all bandwidth.
The report highlights the balancing act that security teams face. Too much focus on the high profile, high risk sharing applications may leave other applications vulnerable. Yet, clearly the data shows that the high value assets are in need of added levels of security. The best approach is a systematic and comprehensive one. Identify the applications and their business use case to determine appropriate safe enablement and network segmentation policies.
Related Blogs
Our library of online content is here to help you learn more, no matter what format you prefer or which topic interests you most.
Subscribe to the Newsletter!
Sign up to receive must-read articles, Playbooks of the Week, new feature announcements, and more.
By submitting this form, you agree to our Terms of Use and acknowledge our Privacy Statement. Please look for a confirmation email from us. If you don't receive it in the next 10 minutes, please check your spam folder.